Skip to contents

micromort

A data package providing curated datasets of micromort (acute risk) and microlife (chronic risk) values from authoritative sources including Wikipedia, CDC MMWR, and academic literature. ## Features

  • 62 acute risks measured in micromorts (one-in-a-million death probability per event)
  • 35+ chronic factors measured in microlives (30-minute life expectancy change per day)
  • 14 authoritative sources with full provenance tracking
  • Parquet datasets for cross-language compatibility (R, Python, Arrow)
  • Plumber REST API for programmatic access
  • Interactive dashboard for data exploration
  • targets pipeline for reproducible data updates

Architecture

%%{init: {'theme': 'dark', 'themeVariables': {'primaryColor': '#999999', 'primaryTextColor': '#000000', 'primaryBorderColor': '#CC0000', 'lineColor': '#CC0000', 'secondaryColor': '#999999', 'tertiaryColor': '#999999', 'background': '#000000', 'mainBkg': '#999999', 'nodeBorder': '#CC0000', 'clusterBkg': '#333333', 'clusterBorder': '#CC0000', 'titleColor': '#000000', 'edgeLabelBackground': '#999999'}}}%%
graph LR

  Conversion["Unit Conversion<br>5 functions"]
  Data["Risk Datasets<br>21 functions"]
  Analysis["Risk Analysis<br>6 functions"]
  Viz["Visualization<br>5 functions"]
  Apps["Interactive Apps<br>6 functions"]

  Conversion --> Data --> Analysis --> Viz --> Apps

  style Conversion fill:#999999,stroke:#CC0000,color:#000000
  style Data fill:#999999,stroke:#CC0000,color:#000000
  style Analysis fill:#999999,stroke:#CC0000,color:#000000
  style Viz fill:#999999,stroke:#CC0000,color:#000000
  style Apps fill:#999999,stroke:#CC0000,color:#000000

See the Architecture vignette for detailed diagrams of the data pipeline, function hierarchy, and user journey.

Installation

# Install from r-universe (pre-built binaries, fast)
install.packages("micromort", repos = "https://johngavin.r-universe.dev")

GitHub

# Install from GitHub (source)
# install.packages("devtools")
devtools::install_github("JohnGavin/micromort")

Nix Users

This project provides a reproducible Nix environment with pre-built binaries from the johngavin cachix cache:

# Enter project shell (uses cachix cache for fast builds)
./default.sh

# Start R
R

Using with rix

To include micromort in your own Nix-based R project:

library(rix)

rix(
  r_pkgs = c("dplyr", "ggplot2"),
  git_pkgs = list(
    list(
      package_name = "micromort",
      repo_url = "https://github.com/JohnGavin/micromort",
      commit = "main"  # Or specific SHA for reproducibility
    )
  ),
  project_path = ".",
  overwrite = TRUE
)

Concepts

Micromort (Acute Risk)

A micromort is a unit of mortality risk equal to a one-in-a-million probability of death per specific event.

  • Unit: 1 micromort = 1/1,000,000 = 0.0001% death probability
  • Scope: Per discrete event (e.g., one skydive, one surgery, one flight)
  • Sign: Always non-negative (it’s a probability)
  • Example: Skydiving has ~8 micromorts per jump (8-in-a-million death chance per jump)

Microlife (Chronic Risk)

A microlife is a unit of life expectancy change equal to 30 minutes of expected lifespan, measured per day of exposure.

  • Unit: 1 microlife = 30 minutes of life expectancy
  • Scope: Per day of maintaining a habit or exposure
  • Sign: Positive (life gained) or negative (life lost)
  • Example: Smoking 2 cigarettes daily costs -1 microlife/day (losing 30 mins of life expectancy each day you smoke)

Conversion

1 micromort ≈ 0.7 microlives (assuming 40 years remaining life expectancy). The conversion scales linearly with remaining life expectancy:

Remaining life expectancy 1 micromort ≈
10 years 0.18 microlives
20 years 0.35 microlives
40 years (default) 0.70 microlives
60 years 1.05 microlives

Use lle(prob, life_expectancy = ...) and as_microlife() to convert at any age. See the Age-Based Hazard Rates section for daily micromort exposure by age.

Morbidity Metrics

Micromorts and microlives focus on mortality. For quality-of-life impacts:

  • QALY (Quality-Adjusted Life Year): 1 year of perfect health. Used in healthcare economics.
  • DALY (Disability-Adjusted Life Years): Disease burden combining:
    • YLL (Years of Life Lost): Premature mortality component
    • YLD (Years Lived with Disability): Morbidity component
  • QALD (Quality-Adjusted Life Days): 1 day of perfect health. For common illnesses.

See the Introduction vignette for detailed examples and the Glossary for all acronym definitions.

Quick Start

Load the Datasets

library(micromort)

# Load acute risks (micromorts per event)
acute <- load_acute_risks()
nrow(acute)
#> [1] 62

# Load chronic risks (microlives per day)
chronic <- load_chronic_risks()
nrow(chronic)
#> [1] 22

# Load source registry
sources <- load_sources()
nrow(sources)
#> [1] 14

Acute Risks (Micromorts per Event)

# Convert a probability to micromorts
# Example: 1 in 10,000 chance = 100 micromorts
as_micromort(1/10000)
#> [1] 100

# Top 10 riskiest activities (micromorts per event/period)
acute |>
  dplyr::select(activity, micromorts, category, period) |>
  head(10)
#> # A tibble: 10 × 4
#>    activity                                micromorts category       period     
#>    <chr>                                        <dbl> <chr>          <chr>      
#>  1 Mt. Everest ascent                           37932 Mountaineering per ascent 
#>  2 Himalayan mountaineering                     12000 Mountaineering per expedi…
#>  3 COVID-19 infection (unvaccinated)            10000 Disease        per infect…
#>  4 Spanish flu infection                         3000 Disease        per infect…
#>  5 Matterhorn ascent                             2840 Mountaineering per ascent 
#>  6 Living in US during COVID-19 (Jul 2020)        500 Disease        per month  
#>  7 Living (one day, age 90)                       463 Daily Life     per day    
#>  8 Base jumping (per jump)                        430 Sport          per event  
#>  9 First day of life (newborn)                    430 Daily Life     per day    
#> 10 COVID-19 unvaccinated (age 80+)                234 COVID-19       11 weeks (…

Caption: Micromorts represent probability of death per event. Higher values = higher risk per occurrence.

Chronic Risks (Microlives per Day)

# Factors that reduce life expectancy (microlives lost per day)
chronic |>
  dplyr::filter(direction == "loss") |>
  dplyr::select(factor, microlives_per_day, category) |>
  head(10)
#> # A tibble: 10 × 3
#>    factor                   microlives_per_day category    
#>    <chr>                                 <dbl> <chr>       
#>  1 Smoking 20 cigarettes                   -10 Smoking     
#>  2 Smoking 10 cigarettes                    -5 Smoking     
#>  3 Being male (vs female)                   -4 Demographics
#>  4 Being 15 kg overweight                   -3 Weight      
#>  5 Being 10 kg overweight                   -2 Weight      
#>  6 4th-5th alcoholic drink                  -2 Alcohol     
#>  7 Smoking 2 cigarettes                     -1 Smoking     
#>  8 Being 5 kg overweight                    -1 Weight      
#>  9 2nd-3rd alcoholic drink                  -1 Alcohol     
#> 10 Red meat (1 portion/day)                 -1 Diet

Caption: Microlives per day. Negative values = life expectancy loss; positive = gain. Effects accumulate daily.

Visualize Risks

# Filter to show only activities with micromorts >= 1 for clarity on log scale
plot_risks(common_risks() |> dplyr::filter(micromorts >= 1))
#> Warning in ggplot2::scale_y_log10(labels = scales::comma, limits = c(0.01, : log-10 transformation introduced infinite values.
#> log-10 transformation introduced infinite values.

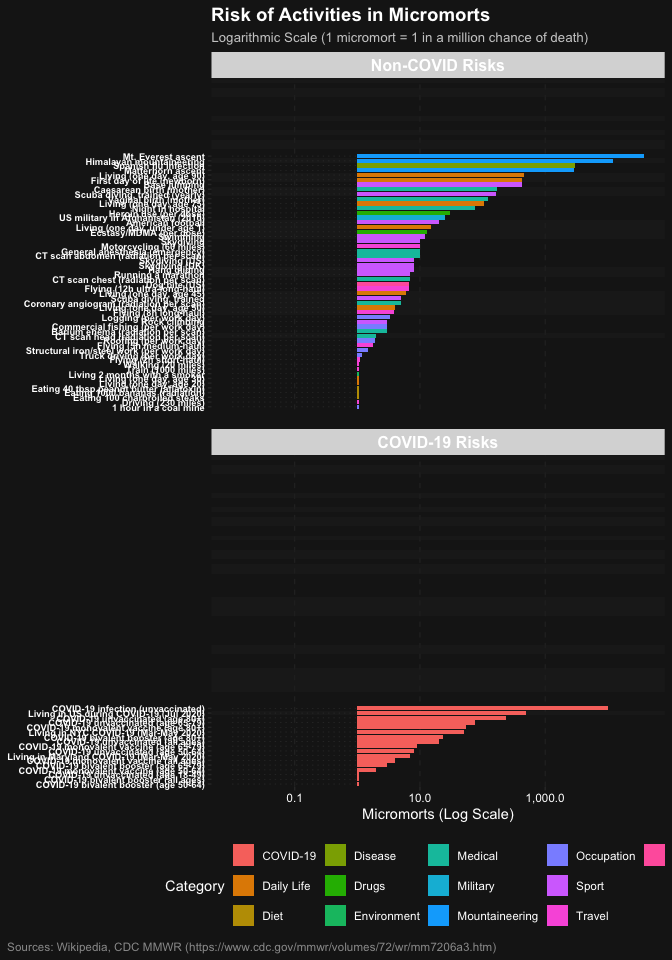
Risk comparison in micromorts (log scale). Bars show death probability per event. COVID-19 and other risks shown in separate panels for clarity.

Analysis Functions

Compare Lifestyle Interventions

# Compare quitting smoking vs losing weight (microlives gained per day)
compare_interventions(list(
  "Quit 10 cigarettes/day" = list(factor = "Smoking 10 cigarettes", change = -1),
  "Lose 5kg" = list(factor = "Being 5 kg overweight", change = -1)
))
#> # A tibble: 2 × 7
#>   intervention      factor original_ml_per_day change net_ml_per_day annual_days
#>   <chr>             <chr>                <dbl>  <dbl>          <dbl>       <dbl>
#> 1 Quit 10 cigarett… Smoki…                  -5     -1             -5       -38  
#> 2 Lose 5kg          Being…                  -1     -1             -1        -7.6
#> # ℹ 1 more variable: lifetime_years <dbl>

Calculate Baseline Risk by Age

# Daily baseline mortality risk at age 35 (micromorts per day just from being alive)
daily_hazard_rate(35)
#> # A tibble: 1 × 6
#>     age sex   daily_prob micromorts microlives_consumed interpretation          
#>   <dbl> <chr>      <dbl>      <dbl>               <dbl> <chr>                   
#> 1    35 male  0.00000296          3                0.05 At age 35 (male): 3.0 m…

Lifestyle Tradeoffs

# How much exercise offsets smoking? (in microlives per day)
lifestyle_tradeoff("Smoking 2 cigarettes", "20 min moderate exercise")
#> # A tibble: 1 × 6
#>   bad_habit            bad_ml_per_day good_habit    good_ml_per_day units_needed
#>   <chr>                         <dbl> <chr>                   <dbl>        <dbl>
#> 1 Smoking 2 cigarettes             -1 20 min moder…               2          0.5
#> # ℹ 1 more variable: interpretation <chr>

API Access

Launch the REST API for programmatic access:

launch_api()
# API available at http://localhost:8080
# Swagger docs at http://localhost:8080/__docs__/

Core endpoints (30 total — see REST API vignette for full reference):

  • GET /v1/risks/acute — Acute risks (micromorts per event)
  • GET /v1/risks/chronic — Chronic risks (microlives per day)
  • GET /v1/risks/cancer — Cancer mortality by type/sex/age
  • GET /v1/analysis/equivalence — Risk equivalence lookup
  • GET /v1/convert/hazard-rate?age=35 — Daily hazard rate
  • GET /v1/sources — Source registry
  • GET /health — Health check

Interactive Dashboard

Launch the Shiny dashboard:

Risk Quiz

Play in browser — runs via WebR/Shinylive (30-60s initial load). Or locally:

micromort::launch_quiz()

Data Sources

Source Type Data
Wikipedia: Micromort Encyclopedia ~50 acute risks
Wikipedia: Microlife Encyclopedia ~20 chronic risks
micromorts.rip Database ~45 acute risks
CDC MMWR Government COVID vaccine data
Spiegelhalter (2012) BMJ Academic Microlife framework
SEER Cancer Statistics Government Cancer mortality by type/sex

Project Structure

Click to expand project tree
#> .
#> ├── DESCRIPTION
#> ├── LICENSE
#> ├── LICENSE.md
#> ├── NAMESPACE
#> ├── R
#> │   ├── activity_descriptions.R
#> │   ├── api.R
#> │   ├── atomic_risks.R
#> │   ├── dashboard.R
#> │   ├── data.R
#> │   ├── dev
#> │   │   ├── issues
#> │   │   └── verify_pkgdown_urls.R
#> │   ├── diagrams.R
#> │   ├── micromort.R
#> │   ├── models.R
#> │   ├── quiz.R
#> │   ├── radiation_profiles.R
#> │   ├── regional.R
#> │   ├── risk_equivalence.R
#> │   ├── risks.R
#> │   ├── tar_plans
#> │   │   ├── plan_data_acquisition.R
#> │   │   ├── plan_documentation.R
#> │   │   ├── plan_export.R
#> │   │   ├── plan_logging.R
#> │   │   ├── plan_normalization.R
#> │   │   ├── plan_qa_gates.R
#> │   │   ├── plan_telemetry.R
#> │   │   ├── plan_validation.R
#> │   │   └── plan_vignette_outputs.R
#> │   └── visualization.R
#> ├── README.md
#> ├── README.qmd
#> ├── README.rmarkdown
#> ├── README_files
#> │   └── libs
#> │       ├── bootstrap
#> │       ├── clipboard
#> │       └── quarto-html
#> ├── box
#> │   ├── api
#> │   │   ├── __init__.R
#> │   │   └── endpoints.R
#> │   ├── dashboard
#> │   │   ├── __init__.R
#> │   │   ├── server.R
#> │   │   └── ui.R
#> │   ├── data
#> │   │   ├── __init__.R
#> │   │   ├── loaders.R
#> │   │   ├── parsers.R
#> │   │   └── schemas.R
#> │   └── models
#> │       ├── __init__.R
#> │       ├── compare.R
#> │       └── hazard.R
#> ├── check
#> │   ├── micromort.Rcheck
#> │   │   ├── 00_pkg_src
#> │   │   ├── 00check.log
#> │   │   ├── 00install.out
#> │   │   ├── R_check_bin
#> │   │   ├── micromort
#> │   │   ├── micromort-Ex.R
#> │   │   ├── micromort-Ex.Rout
#> │   │   ├── micromort-Ex.pdf
#> │   │   └── micromort-Ex.timings
#> │   └── micromort_0.1.0.tar.gz
#> ├── data-raw
#> │   ├── 01_extract_current_data.R
#> │   ├── 02_regional_life_expectancy.R
#> │   ├── 02_regional_life_expectancy_sample.R
#> │   ├── 03_osha_occupational_risks.R
#> │   ├── 04_road_traffic_mortality.R
#> │   ├── 05_global_homicide_rates.R
#> │   ├── README_regional_data.md
#> │   ├── generate_og_image.R
#> │   ├── generate_quiz_csv.R
#> │   └── sources
#> │       ├── acute_risks_base.csv
#> │       ├── chronic_risks_base.csv
#> │       ├── covid_vaccine_rr.csv
#> │       ├── demographic_factors.csv
#> │       └── risk_sources.csv
#> ├── default.R
#> ├── default.nix
#> ├── default.sh
#> ├── docs
#> │   ├── 404.html
#> │   ├── 404.md
#> │   ├── LICENSE-text.html
#> │   ├── LICENSE-text.md
#> │   ├── LICENSE.html
#> │   ├── LICENSE.md
#> │   ├── articles
#> │   │   ├── architecture.html
#> │   │   ├── architecture.md
#> │   │   ├── architecture_files
#> │   │   ├── confounding.html
#> │   │   ├── confounding.md
#> │   │   ├── confounding_files
#> │   │   ├── data_reliability.html
#> │   │   ├── data_reliability.md
#> │   │   ├── data_reliability_files
#> │   │   ├── index.html
#> │   │   ├── index.md
#> │   │   ├── introduction.html
#> │   │   ├── introduction.md
#> │   │   ├── introduction_files
#> │   │   ├── palatable_units.html
#> │   │   ├── palatable_units.md
#> │   │   ├── palatable_units_files
#> │   │   ├── quiz_shinylive.html
#> │   │   ├── quiz_shinylive_files
#> │   │   ├── regional_variation.html
#> │   │   ├── regional_variation.md
#> │   │   ├── regional_variation_files
#> │   │   ├── rest_api.html
#> │   │   ├── rest_api.md
#> │   │   ├── rest_api_files
#> │   │   ├── risk_equivalence.html
#> │   │   ├── risk_equivalence.md
#> │   │   ├── risk_equivalence_files
#> │   │   ├── shinylive-sw.js
#> │   │   ├── telemetry.html
#> │   │   ├── telemetry.md
#> │   │   └── telemetry_files
#> │   ├── authors.html
#> │   ├── authors.md
#> │   ├── deps
#> │   │   ├── bootstrap-5.3.1
#> │   │   ├── bootstrap-toc-1.0.1
#> │   │   ├── clipboard.js-2.0.11
#> │   │   ├── data-deps.txt
#> │   │   ├── font-awesome-6.5.2
#> │   │   ├── headroom-0.11.0
#> │   │   ├── jquery-3.6.0
#> │   │   └── search-1.0.0
#> │   ├── extra.css
#> │   ├── extra.js
#> │   ├── index.html
#> │   ├── index.md
#> │   ├── katex-auto.js
#> │   ├── lightswitch.js
#> │   ├── link.svg
#> │   ├── llms.txt
#> │   ├── news
#> │   ├── pkgdown.js
#> │   ├── pkgdown.yml
#> │   ├── reference
#> │   │   ├── activity_descriptions.html
#> │   │   ├── activity_descriptions.md
#> │   │   ├── acute_risks.html
#> │   │   ├── acute_risks.md
#> │   │   ├── annual_risk_budget.html
#> │   │   ├── annual_risk_budget.md
#> │   │   ├── as_microlife.html
#> │   │   ├── as_microlife.md
#> │   │   ├── as_micromort.html
#> │   │   ├── as_micromort.md
#> │   │   ├── as_probability.html
#> │   │   ├── as_probability.md
#> │   │   ├── atomic_risks.html
#> │   │   ├── atomic_risks.md
#> │   │   ├── cancer_risks.html
#> │   │   ├── cancer_risks.md
#> │   │   ├── chronic_risks.html
#> │   │   ├── chronic_risks.md
#> │   │   ├── common_risks.html
#> │   │   ├── common_risks.md
#> │   │   ├── compare_interventions.html
#> │   │   ├── compare_interventions.md
#> │   │   ├── conditional_risk.html
#> │   │   ├── conditional_risk.md
#> │   │   ├── covid_vaccine_rr.html
#> │   │   ├── covid_vaccine_rr.md
#> │   │   ├── daily_hazard_rate.html
#> │   │   ├── daily_hazard_rate.md
#> │   │   ├── demographic_factors.html
#> │   │   ├── demographic_factors.md
#> │   │   ├── figures
#> │   │   ├── format_activity_name.html
#> │   │   ├── format_activity_name.md
#> │   │   ├── hedged_portfolio.html
#> │   │   ├── hedged_portfolio.md
#> │   │   ├── index.html
#> │   │   ├── index.md
#> │   │   ├── laggard_regions.html
#> │   │   ├── laggard_regions.md
#> │   │   ├── launch_api.html
#> │   │   ├── launch_api.md
#> │   │   ├── launch_dashboard.html
#> │   │   ├── launch_dashboard.md
#> │   │   ├── launch_quiz.html
#> │   │   ├── launch_quiz.md
#> │   │   ├── libs
#> │   │   ├── lifestyle_tradeoff.html
#> │   │   ├── lifestyle_tradeoff.md
#> │   │   ├── lle.html
#> │   │   ├── lle.md
#> │   │   ├── load_acute_risks.html
#> │   │   ├── load_acute_risks.md
#> │   │   ├── load_chronic_risks.html
#> │   │   ├── load_chronic_risks.md
#> │   │   ├── load_sources.html
#> │   │   ├── load_sources.md
#> │   │   ├── patient_radiation_comparison.html
#> │   │   ├── patient_radiation_comparison.md
#> │   │   ├── plot_risk_components-1.png
#> │   │   ├── plot_risk_components.html
#> │   │   ├── plot_risk_components.md
#> │   │   ├── plot_risks-1.png
#> │   │   ├── plot_risks-2.png
#> │   │   ├── plot_risks-3.png
#> │   │   ├── plot_risks-4.png
#> │   │   ├── plot_risks-5.png
#> │   │   ├── plot_risks.html
#> │   │   ├── plot_risks.md
#> │   │   ├── plot_risks_interactive.html
#> │   │   ├── plot_risks_interactive.md
#> │   │   ├── prepare_risks_plot-1.png
#> │   │   ├── prepare_risks_plot.html
#> │   │   ├── prepare_risks_plot.md
#> │   │   ├── quiz_pairs.html
#> │   │   ├── quiz_pairs.md
#> │   │   ├── radiation_profiles.html
#> │   │   ├── radiation_profiles.md
#> │   │   ├── regional_life_expectancy.html
#> │   │   ├── regional_life_expectancy.md
#> │   │   ├── regional_mortality_multiplier.html
#> │   │   ├── regional_mortality_multiplier.md
#> │   │   ├── risk_components.html
#> │   │   ├── risk_components.md
#> │   │   ├── risk_data_sources.html
#> │   │   ├── risk_data_sources.md
#> │   │   ├── risk_equivalence.html
#> │   │   ├── risk_equivalence.md
#> │   │   ├── risk_exchange_matrix.html
#> │   │   ├── risk_exchange_matrix.md
#> │   │   ├── risk_for_duration.html
#> │   │   ├── risk_for_duration.md
#> │   │   ├── risk_sources.html
#> │   │   ├── risk_sources.md
#> │   │   ├── theme_micromort_dark-1.png
#> │   │   ├── theme_micromort_dark.html
#> │   │   ├── theme_micromort_dark.md
#> │   │   ├── vaccination_risks.html
#> │   │   ├── vaccination_risks.md
#> │   │   ├── value_of_micromort.html
#> │   │   ├── value_of_micromort.md
#> │   │   ├── vanguard_regions.html
#> │   │   └── vanguard_regions.md
#> │   ├── search.json
#> │   ├── sitemap.xml
#> │   └── tutorials
#> ├── inst
#> │   ├── dashboard
#> │   │   └── about.md
#> │   ├── extdata
#> │   │   ├── acute_risks.parquet
#> │   │   ├── chronic_risks.parquet
#> │   │   ├── logs
#> │   │   ├── regional_life_expectancy.parquet
#> │   │   ├── risk_sources.parquet
#> │   │   └── vignettes
#> │   └── plumber
#> │       └── api.R
#> ├── man
#> │   ├── activity_descriptions.Rd
#> │   ├── acute_risks.Rd
#> │   ├── annual_risk_budget.Rd
#> │   ├── as_microlife.Rd
#> │   ├── as_micromort.Rd
#> │   ├── as_probability.Rd
#> │   ├── atomic_risks.Rd
#> │   ├── cancer_risks.Rd
#> │   ├── chronic_risks.Rd
#> │   ├── common_risks.Rd
#> │   ├── compare_interventions.Rd
#> │   ├── conditional_risk.Rd
#> │   ├── covid_vaccine_rr.Rd
#> │   ├── daily_hazard_rate.Rd
#> │   ├── demographic_factors.Rd
#> │   ├── figures
#> │   │   ├── README-plot-1.png
#> │   │   ├── logo-candidates
#> │   │   ├── logo.png
#> │   │   └── og-image.png
#> │   ├── format_activity_name.Rd
#> │   ├── hedged_portfolio.Rd
#> │   ├── laggard_regions.Rd
#> │   ├── launch_api.Rd
#> │   ├── launch_dashboard.Rd
#> │   ├── launch_quiz.Rd
#> │   ├── lifestyle_tradeoff.Rd
#> │   ├── lle.Rd
#> │   ├── load_acute_risks.Rd
#> │   ├── load_chronic_risks.Rd
#> │   ├── load_sources.Rd
#> │   ├── patient_radiation_comparison.Rd
#> │   ├── plot_risk_components.Rd
#> │   ├── plot_risks.Rd
#> │   ├── plot_risks_interactive.Rd
#> │   ├── prepare_risks_plot.Rd
#> │   ├── quiz_pairs.Rd
#> │   ├── radiation_profiles.Rd
#> │   ├── regional_life_expectancy.Rd
#> │   ├── regional_mortality_multiplier.Rd
#> │   ├── risk_components.Rd
#> │   ├── risk_data_sources.Rd
#> │   ├── risk_equivalence.Rd
#> │   ├── risk_exchange_matrix.Rd
#> │   ├── risk_for_duration.Rd
#> │   ├── risk_sources.Rd
#> │   ├── theme_micromort_dark.Rd
#> │   ├── vaccination_risks.Rd
#> │   ├── value_of_micromort.Rd
#> │   └── vanguard_regions.Rd
#> ├── nix-shell-root
#> ├── package.nix
#> ├── pkgdown
#> │   ├── extra.css
#> │   └── extra.js
#> ├── plans
#> │   ├── PLAN_consistency_refactor.md
#> │   ├── PLAN_regional_longevity.md
#> │   ├── PLAN_risk_equivalence_dashboard.md
#> │   └── PLAN_vignette_targets_refactor.md
#> ├── push_to_cachix.sh
#> ├── tests
#> │   └── testthat
#> │       ├── test-adversarial.R
#> │       ├── test-api.R
#> │       ├── test-atomic-risks.R
#> │       ├── test-diagrams.R
#> │       ├── test-quiz.R
#> │       ├── test-radiation-profiles.R
#> │       ├── test-risk-components.R
#> │       ├── test-risk-equivalence.R
#> │       └── test-visualization.R
#> └── vignettes
#>     ├── _extensions
#>     │   └── quarto-ext
#>     ├── _quarto.yml
#>     ├── architecture.qmd
#>     ├── architecture_files
#>     ├── confounding.qmd
#>     ├── data_reliability.qmd
#>     ├── introduction.qmd
#>     ├── palatable_units.qmd
#>     ├── quiz_shinylive.qmd
#>     ├── quiz_shinylive_files
#>     │   └── libs
#>     ├── regional_variation.qmd
#>     ├── rest_api.qmd
#>     ├── risk_equivalence.qmd
#>     ├── risk_equivalence_files
#>     ├── shinylive-sw.js
#>     └── telemetry.qmd

Contributing

Contributions are welcome! Please:

  1. Report issues at GitHub Issues
  2. Submit PRs following the tidyverse style guide
  3. Add data - New risk sources welcome! Include:
    • Source URL with citation
    • Units (micromorts per event OR microlives per day)
    • Period specification (per jump, per day, per year, etc.)

Development Setup

Requires Nix (the ./default.sh script builds a reproducible R environment via Nix):

# Clone and enter Nix environment
git clone https://github.com/JohnGavin/micromort.git
cd micromort
./default.sh   # Requires Nix — builds reproducible R env with all dependencies

# Run tests
Rscript -e "devtools::test()"

# Check package
Rscript -e "devtools::check()"

Glossary

Acronym Full Name Definition
DALY Disability-Adjusted Life Year Disease burden = YLL + YLD. 1 DALY = 1 year of healthy life lost.
LLE Loss of Life Expectancy Expected lifespan reduction from a risk, in minutes. See lle().
QALD Quality-Adjusted Life Day 1 day of perfect health. Useful for short-duration conditions.
QALY Quality-Adjusted Life Year 1 year of perfect health. Used in healthcare cost-effectiveness.
VSL Value of Statistical Life Monetary value society places on preventing one death (~$10M USD). See value_of_micromort().
YLD Years Lived with Disability Morbidity component of DALY. Time spent in impaired health.
YLL Years of Life Lost Mortality component of DALY. Premature death relative to standard life expectancy.

References

  • Howard RA (1980). “On Making Life and Death Decisions.” Societal Risk Assessment.
  • Spiegelhalter D (2012). “Using speed of ageing and ‘microlives’.” BMJ 345:e8223. DOI: 10.1136/bmj.e8223
  • Blastland M, Spiegelhalter D (2013). The Norm Chronicles: Stories and Numbers About Danger.

License

MIT © John Gavin

See LICENSE for details.