This vignette tracks the health and evolution of the micromort pipeline, codebase, and GitHub activity. All data is pre-computed via targets — zero inline computation.
1. Pipeline Metrics
Dependency Graph
Show code
dep_graph <- safe_tar_read("vig_pipeline_dependency_graph")
if (!is.null(dep_graph)) {
  # Render mermaid via htmltools
  htmltools::HTML(paste0(
    '<script src="https://cdn.jsdelivr.net/npm/mermaid@11/dist/mermaid.min.js"></script>',
    '<script>mermaid.initialize({startOnLoad: true, securityLevel: "loose", theme: "dark"});</script>',
    '<div class="mermaid" style="background-color: #000000; padding: 1em;">\n', dep_graph, '\n</div>'
  ))
} else {
  htmltools::p("Dependency graph not available. Run tar_make() first.")
}
Dependency graph not available. Run tar_make() first.
Target dependency graph showing data flow across the micromort pipeline. Nodes represent individual targets; edges show upstream dependencies. The graph spans data acquisition, normalization, export, logging, documentation, telemetry, and vignette output stages. Built from targets::tar_network() edges. See the introduction vignette for a conceptual overview of the pipeline architecture.
Plans and Targets
Show code
summary <- safe_tar_read("vig_pipeline_summary")
if (!is.null(summary)) {
  summary$plans |>
    DT::datatable(
      caption = paste0(
        "Target counts by plan file (",
        summary$total_targets, " total targets)"
      ),
      options = list(pageLength = 10, dom = "t"),
      rownames = FALSE
    )
}
Top 5 Targets by Storage Size
Top 5 Targets by Compute Time
2. GitHub Activity
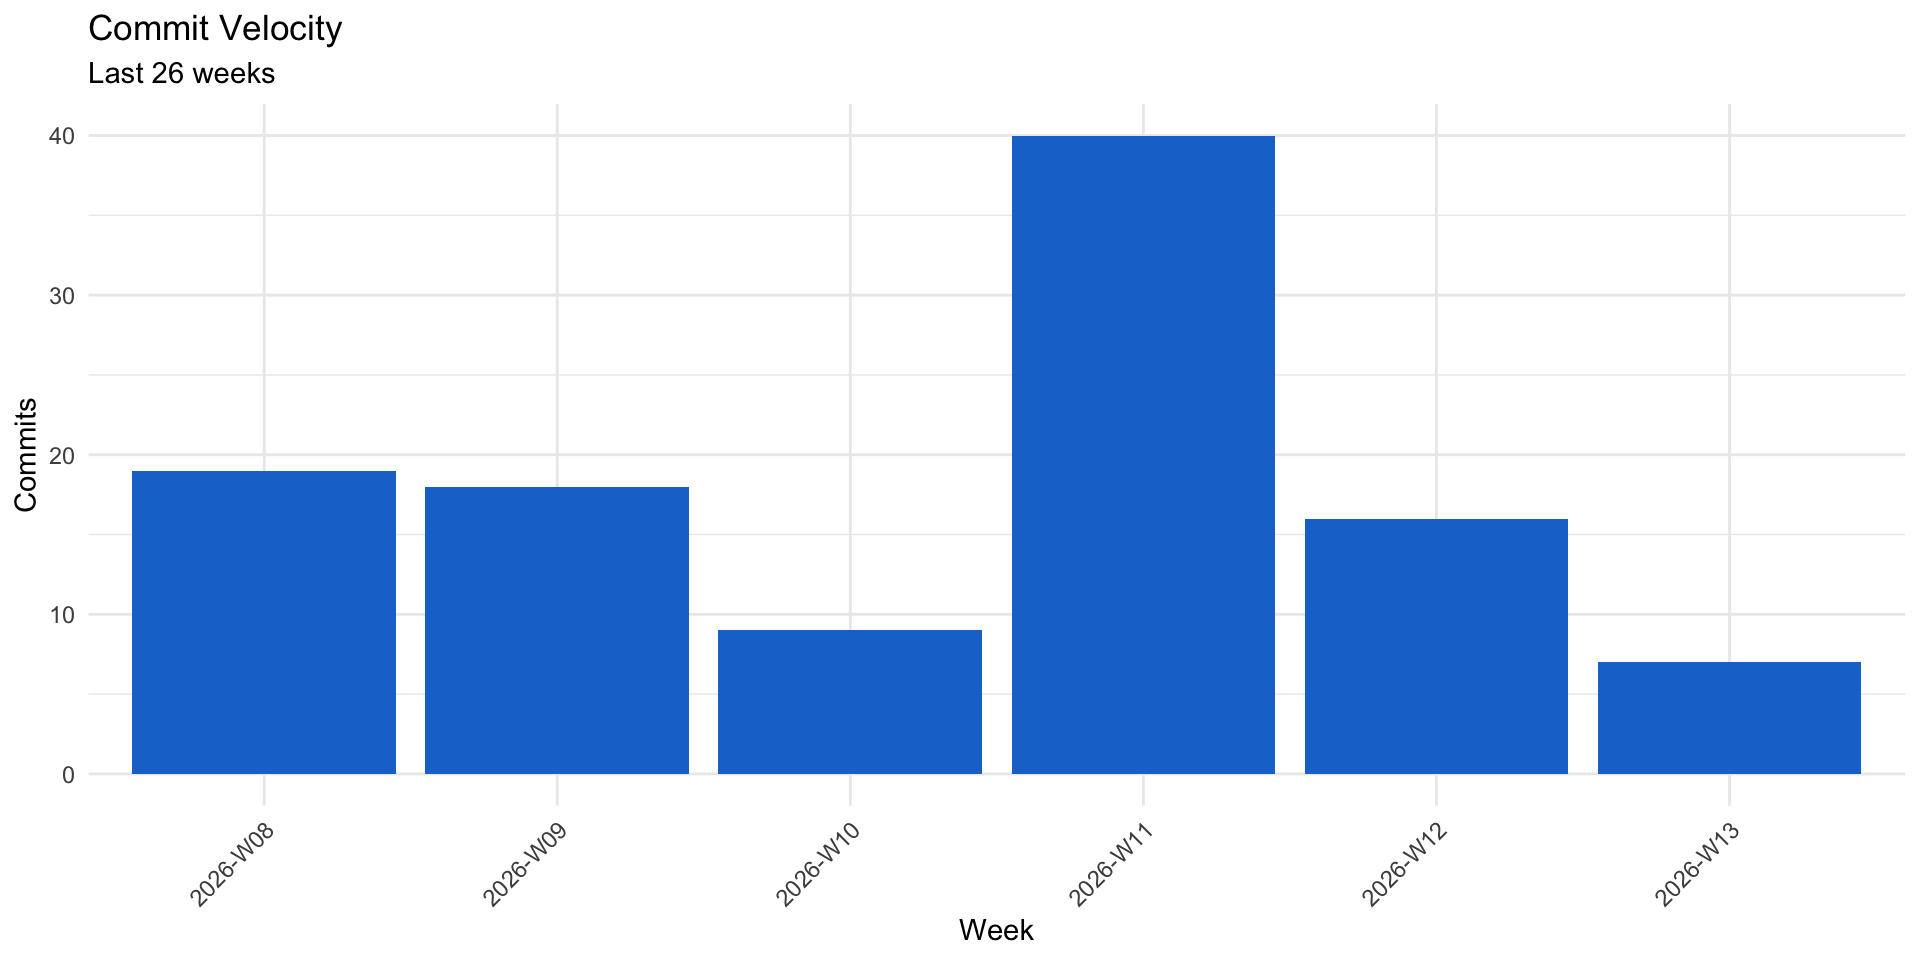
Commit Velocity
Show code
velocity <- safe_tar_read("vig_commit_velocity")
if (!is.null(velocity)) {
  ggplot2::ggplot(velocity, ggplot2::aes(x = week, y = commits)) +
    ggplot2::geom_col(fill = "#1976D2") +
    ggplot2::labs(
      title = "Commit Velocity",
      subtitle = "Last 26 weeks",
      x = "Week",
      y = "Commits"
    ) +
    ggplot2::theme_minimal() +
    ggplot2::theme(axis.text.x = ggplot2::element_text(angle = 45, hjust = 1))
}
Issues and Pull Requests
Show code
activity <- safe_tar_read("vig_github_activity")
if (!is.null(activity)) {
  activity |>
    DT::datatable(
      caption = "GitHub issues and pull requests summary",
      options = list(pageLength = 5, dom = "t"),
      rownames = FALSE
    )
}
3. Project Structure
Show code
metrics <- safe_tar_read("vig_codebase_metrics")
if (!is.null(metrics)) {
  metrics |>
    DT::datatable(
      caption = "Codebase metrics snapshot",
      options = list(pageLength = 10, dom = "t"),
      rownames = FALSE
    )
}
Reproducibility
Show code
sessionInfo()
#> R version 4.5.2 (2025-10-31)
#> Platform: aarch64-apple-darwin25.2.0
#> Running under: macOS Tahoe 26.3.1
#>
#> Matrix products: default
#> BLAS:   /nix/store/ab8sq4g14lg45192ykfqcklgw6fvaswh-blas-3/lib/libblas.dylib
#> LAPACK: /nix/store/ssl6kfm7w37gz5pn57jn2x7xzw3bss24-openblas-0.3.30/lib/libopenblasp-r0.3.30.dylib;  LAPACK version 3.12.0
#>
#> locale:
#> [1] en_US.UTF-8/en_US.UTF-8/en_US.UTF-8/C/en_US.UTF-8/en_US.UTF-8
#>
#> time zone: Europe/Belfast
#> tzcode source: internal
#>
#> attached base packages:
#> [1] stats     graphics  grDevices utils     datasets  methods   base
#>
#> other attached packages:
#> [1] DT_0.34.0       targets_1.11.4  micromort_0.1.0 testthat_3.3.2
#>
#> loaded via a namespace (and not attached):
#>  [1] gtable_0.3.6        xfun_0.56           bslib_0.10.0
#>  [4] ggplot2_4.0.1       htmlwidgets_1.6.4   processx_3.8.6
#>  [7] callr_3.7.6         vctrs_0.7.1         tools_4.5.2
#> [10] crosstalk_1.2.2     ps_1.9.1            generics_0.1.4
#> [13] base64url_1.4       tibble_3.3.1        pkgconfig_2.0.3
#> [16] data.table_1.18.2.1 checkmate_2.3.3     secretbase_1.1.1
#> [19] RColorBrewer_1.1-3  S7_0.2.1            desc_1.4.3
#> [22] assertthat_0.2.1    lifecycle_1.0.5     compiler_4.5.2
#> [25] farver_2.1.2        credentials_2.0.3   brio_1.1.5
#> [28] codetools_0.2-20    sass_0.4.10         htmltools_0.5.9
#> [31] sys_3.4.3           usethis_3.2.1       yaml_2.3.12
#> [34] jquerylib_0.1.4     pillar_1.11.1       openssl_2.3.4
#> [37] cachem_1.1.0        tidyselect_1.2.1    digest_0.6.39
#> [40] dplyr_1.1.4         purrr_1.2.1         labeling_0.4.3
#> [43] arrow_22.0.0        rprojroot_2.1.1     fastmap_1.2.0
#> [46] grid_4.5.2          cli_3.6.5           magrittr_2.0.4
#> [49] pkgbuild_1.4.8      withr_3.0.2         prettyunits_1.2.0
#> [52] scales_1.4.0        backports_1.5.0     bit64_4.6.0-1
#> [55] rmarkdown_2.30      igraph_2.2.1        bit_4.6.0
#> [58] otel_0.2.0          askpass_1.2.1       evaluate_1.0.5
#> [61] knitr_1.51          rlang_1.1.7         gert_2.3.1
#> [64] glue_1.8.0          pkgload_1.4.1       jsonlite_2.0.0
#> [67] R6_2.6.1            fs_1.6.6