Filters and prepares risk data for visualization. Use this to filter
categories before passing to plot_risks().
Usage
prepare_risks_plot(
  risks = common_risks(),
  categories = NULL,
  exclude_categories = NULL,
  min_micromorts = 0.1,
  top_n = NULL
)
Arguments
- risks
Tibble. Dataframe of risks, defaults to
common_risks().- categories
Character vector. Categories to include. Use
NULL(default) for all categories. Seecommon_risks()for available categories.- exclude_categories
Character vector. Categories to exclude. Applied after
categoriesfilter.- min_micromorts
Numeric. Minimum micromorts to include (default 0.1 to avoid invisible bars on log scale).
- top_n
Integer. If specified, return only the top N risks by micromorts.
Value
A tibble ready for plotting with plot_risks().
See also
Other visualization:
plot_risks(),
plot_risks_interactive(),
theme_micromort_dark()
Examples
# All risks
prepare_risks_plot()
#> # A tibble: 91 × 15
#> activity micromorts microlives category period period_type period_days
#> <chr> <dbl> <dbl> <chr> <chr> <chr> <dbl>
#> 1 Mt. Everest as… 37932 26552. Mountai… per a… event 60
#> 2 Himalayan moun… 12000 8400 Mountai… per e… event 45
#> 3 COVID-19 infec… 10000 7000 COVID-19 per i… event 14
#> 4 Spanish flu in… 3000 2100 Disease per i… event 14
#> 5 Matterhorn asc… 2840 1988 Mountai… per a… event 60
#> 6 Living in US d… 500 350 COVID-19 per m… month 30
#> 7 Living (one da… 463 324. Daily L… per d… day 1
#> 8 Base jumping (… 430 301 Sport per j… event 0.003
#> 9 First day of l… 430 301 Daily L… per d… day 1
#> 10 COVID-19 unvac… 234 164. COVID-19 11 we… period 77
#> # ℹ 81 more rows
#> # ℹ 8 more variables: micromorts_per_day <dbl>, source_url <chr>,
#> # n_components <int>, hedgeable_pct <dbl>, confidence <chr>,
#> # estimate_range <chr>, source_count <int>, facet_group <fct>
# Only COVID-19 risks
prepare_risks_plot(categories = "COVID-19")
#> # A tibble: 18 × 15
#> activity micromorts microlives category period period_type period_days
#> <chr> <dbl> <dbl> <chr> <chr> <chr> <dbl>
#> 1 COVID-19 infec… 10000 7000 COVID-19 per i… event 14
#> 2 Living in US d… 500 350 COVID-19 per m… month 30
#> 3 COVID-19 unvac… 234 164. COVID-19 11 we… period 77
#> 4 COVID-19 unvac… 76 53.2 COVID-19 11 we… period 77
#> 5 COVID-19 monov… 55 38.5 COVID-19 11 we… period 77
#> 6 Living in NYC … 50 35 COVID-19 per 8… period 56
#> 7 COVID-19 bival… 23 16.1 COVID-19 11 we… period 77
#> 8 COVID-19 unvac… 20 14 COVID-19 11 we… period 77
#> 9 COVID-19 monov… 9 6.3 COVID-19 11 we… period 77
#> 10 COVID-19 unvac… 8 5.6 COVID-19 11 we… period 77
#> 11 Living in Mary… 7 4.9 COVID-19 per 8… period 56
#> 12 COVID-19 monov… 4 2.8 COVID-19 11 we… period 77
#> 13 COVID-19 bival… 3 2.1 COVID-19 11 we… period 77
#> 14 COVID-19 monov… 2 1.4 COVID-19 11 we… period 77
#> 15 COVID-19 unvac… 1 0.7 COVID-19 11 we… period 77
#> 16 COVID-19 bival… 1 0.7 COVID-19 11 we… period 77
#> 17 COVID-19 bival… 1 0.7 COVID-19 11 we… period 77
#> 18 COVID-19 monov… 0.2 0.1 COVID-19 11 we… period 77
#> # ℹ 8 more variables: micromorts_per_day <dbl>, source_url <chr>,
#> # n_components <int>, hedgeable_pct <dbl>, confidence <chr>,
#> # estimate_range <chr>, source_count <int>, facet_group <fct>
# Exclude COVID-19
prepare_risks_plot(exclude_categories = "COVID-19")
#> # A tibble: 73 × 15
#> activity micromorts microlives category period period_type period_days
#> <chr> <dbl> <dbl> <chr> <chr> <chr> <dbl>
#> 1 Mt. Everest as… 37932 26552. Mountai… per a… event 60
#> 2 Himalayan moun… 12000 8400 Mountai… per e… event 45
#> 3 Spanish flu in… 3000 2100 Disease per i… event 14
#> 4 Matterhorn asc… 2840 1988 Mountai… per a… event 60
#> 5 Living (one da… 463 324. Daily L… per d… day 1
#> 6 Base jumping (… 430 301 Sport per j… event 0.003
#> 7 First day of l… 430 301 Daily L… per d… day 1
#> 8 Caesarean birt… 170 119 Medical per e… event 1
#> 9 Scuba diving, … 164 115. Sport per y… year 365
#> 10 Vaginal birth … 120 84 Medical per e… event 1
#> # ℹ 63 more rows
#> # ℹ 8 more variables: micromorts_per_day <dbl>, source_url <chr>,
#> # n_components <int>, hedgeable_pct <dbl>, confidence <chr>,
#> # estimate_range <chr>, source_count <int>, facet_group <fct>
# Multiple categories
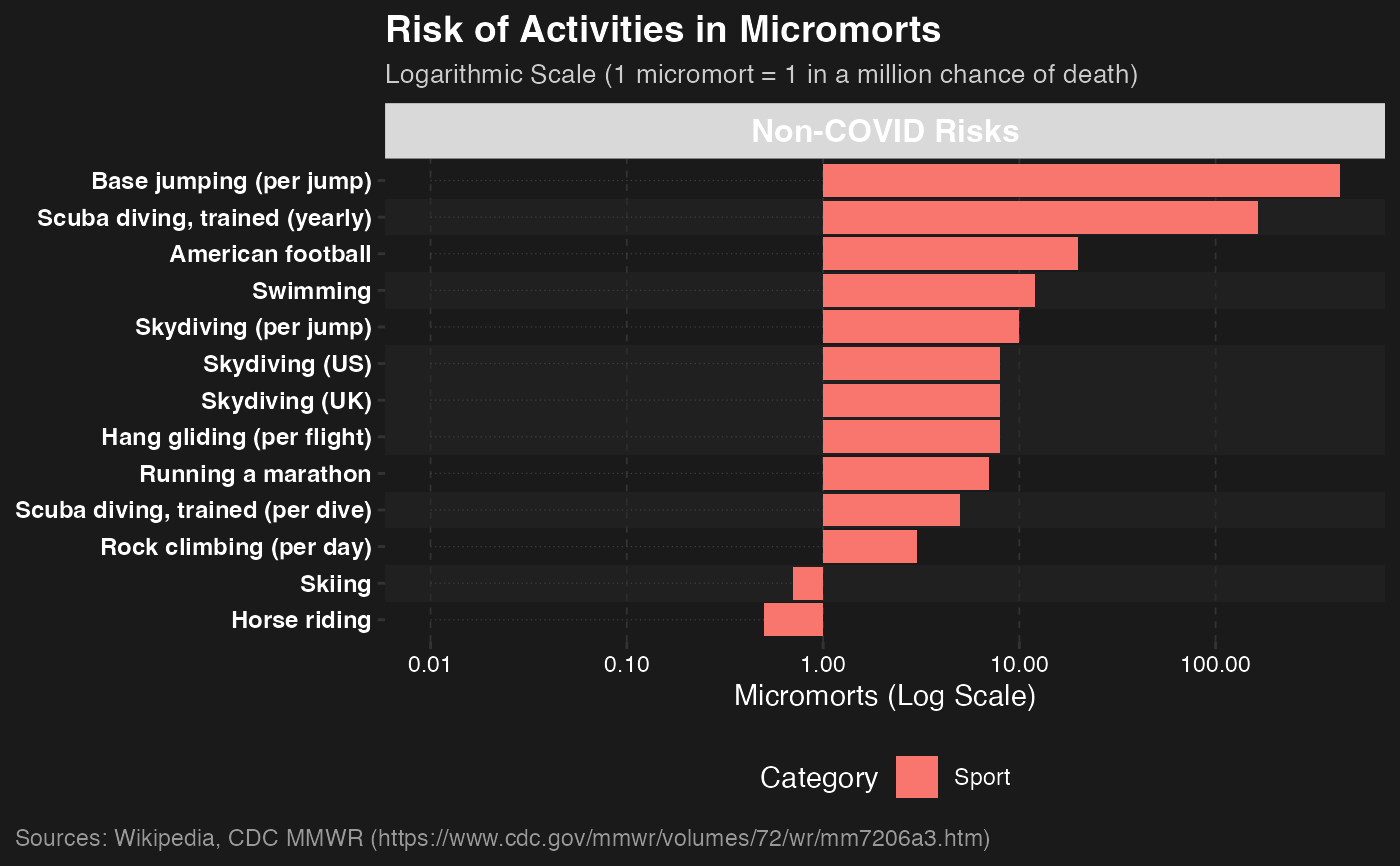
prepare_risks_plot(categories = c("Sport", "Travel"))
#> # A tibble: 24 × 15
#> activity micromorts microlives category period period_type period_days
#> <chr> <dbl> <dbl> <chr> <chr> <chr> <dbl>
#> 1 Base jumping (… 430 301 Sport per j… event 0.003
#> 2 Scuba diving, … 164 115. Sport per y… year 365
#> 3 American footb… 20 14 Sport per g… event 0.13
#> 4 Swimming 12 8.4 Sport per s… event 0.04
#> 5 Motorcycling (… 10 7 Travel per t… event 0.17
#> 6 Skydiving (per… 10 7 Sport per j… event 0.003
#> 7 Skydiving (US) 8 5.6 Sport per e… event 1
#> 8 Skydiving (UK) 8 5.6 Sport per e… event 1
#> 9 Hang gliding (… 8 5.6 Sport per f… event 0.08
#> 10 Running a mara… 7 4.9 Sport per e… event 1
#> # ℹ 14 more rows
#> # ℹ 8 more variables: micromorts_per_day <dbl>, source_url <chr>,
#> # n_components <int>, hedgeable_pct <dbl>, confidence <chr>,
#> # estimate_range <chr>, source_count <int>, facet_group <fct>
# Top 20 risks
prepare_risks_plot(top_n = 20)
#> # A tibble: 20 × 15
#> activity micromorts microlives category period period_type period_days
#> <chr> <dbl> <dbl> <chr> <chr> <chr> <dbl>
#> 1 Mt. Everest as… 37932 26552. Mountai… per a… event 60
#> 2 Himalayan moun… 12000 8400 Mountai… per e… event 45
#> 3 COVID-19 infec… 10000 7000 COVID-19 per i… event 14
#> 4 Spanish flu in… 3000 2100 Disease per i… event 14
#> 5 Matterhorn asc… 2840 1988 Mountai… per a… event 60
#> 6 Living in US d… 500 350 COVID-19 per m… month 30
#> 7 Living (one da… 463 324. Daily L… per d… day 1
#> 8 Base jumping (… 430 301 Sport per j… event 0.003
#> 9 First day of l… 430 301 Daily L… per d… day 1
#> 10 COVID-19 unvac… 234 164. COVID-19 11 we… period 77
#> 11 Caesarean birt… 170 119 Medical per e… event 1
#> 12 Scuba diving, … 164 115. Sport per y… year 365
#> 13 Vaginal birth … 120 84 Medical per e… event 1
#> 14 Living (one da… 105 73.5 Daily L… per d… day 1
#> 15 COVID-19 unvac… 76 53.2 COVID-19 11 we… period 77
#> 16 Night in hospi… 75 52.5 Medical per n… day 1
#> 17 COVID-19 monov… 55 38.5 COVID-19 11 we… period 77
#> 18 Living in NYC … 50 35 COVID-19 per 8… period 56
#> 19 Heroin use (pe… 30 21 Drugs per d… event 0.01
#> 20 US military in… 25 17.5 Military per d… day 1
#> # ℹ 8 more variables: micromorts_per_day <dbl>, source_url <chr>,
#> # n_components <int>, hedgeable_pct <dbl>, confidence <chr>,
#> # estimate_range <chr>, source_count <int>, facet_group <fct>
# Chain with plotting
prepare_risks_plot(categories = "Sport") |> plot_risks()
#> Warning: log-10 transformation introduced infinite values.
#> Warning: log-10 transformation introduced infinite values.
#> Warning: log-10 transformation introduced infinite values.
#> Warning: log-10 transformation introduced infinite values.
#> Warning: log-10 transformation introduced infinite values.