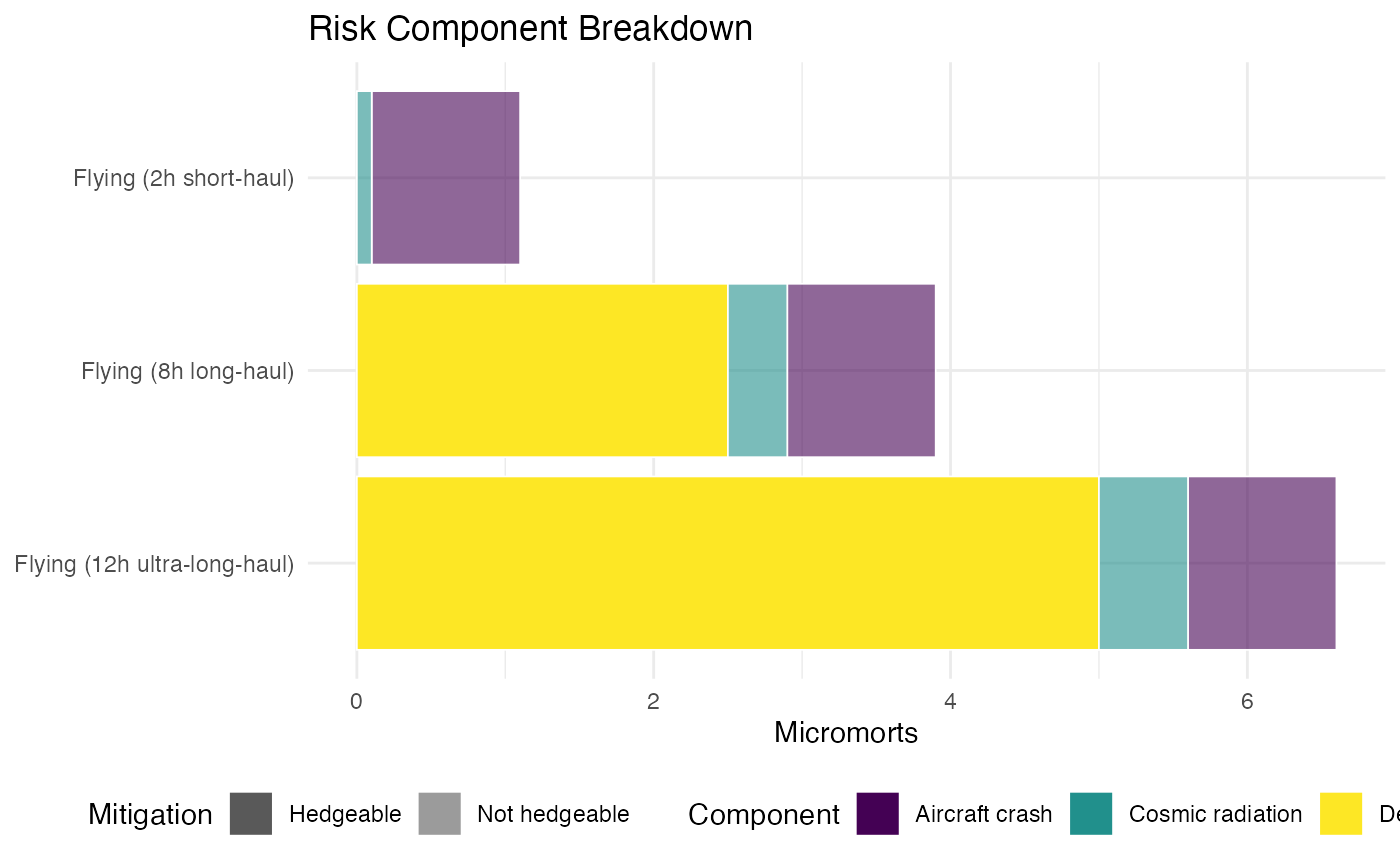
Creates a stacked bar chart showing the breakdown of atomic risk components for selected activities. Hedgeable components are visually distinguished.
Usage
plot_risk_components(activity_ids, profile = list(), risks = NULL)Arguments
- activity_ids
Character vector of activity IDs to plot.
- profile
A named list of condition variables for filtering.
- risks
Optional pre-computed
atomic_risks()tibble.
Examples
plot_risk_components(c("flying_2h", "flying_8h", "flying_12h"))