Plot Tail Thickness Heatmap
Usage
plot_tail_thickness_heatmap(x_points, distributions, interactive = FALSE)
Arguments
- x_points
Vector of x values
- distributions
Vector of distribution names
- interactive
Logical; if TRUE, returns plotly object
Value
ggplot2 or plotly heatmap
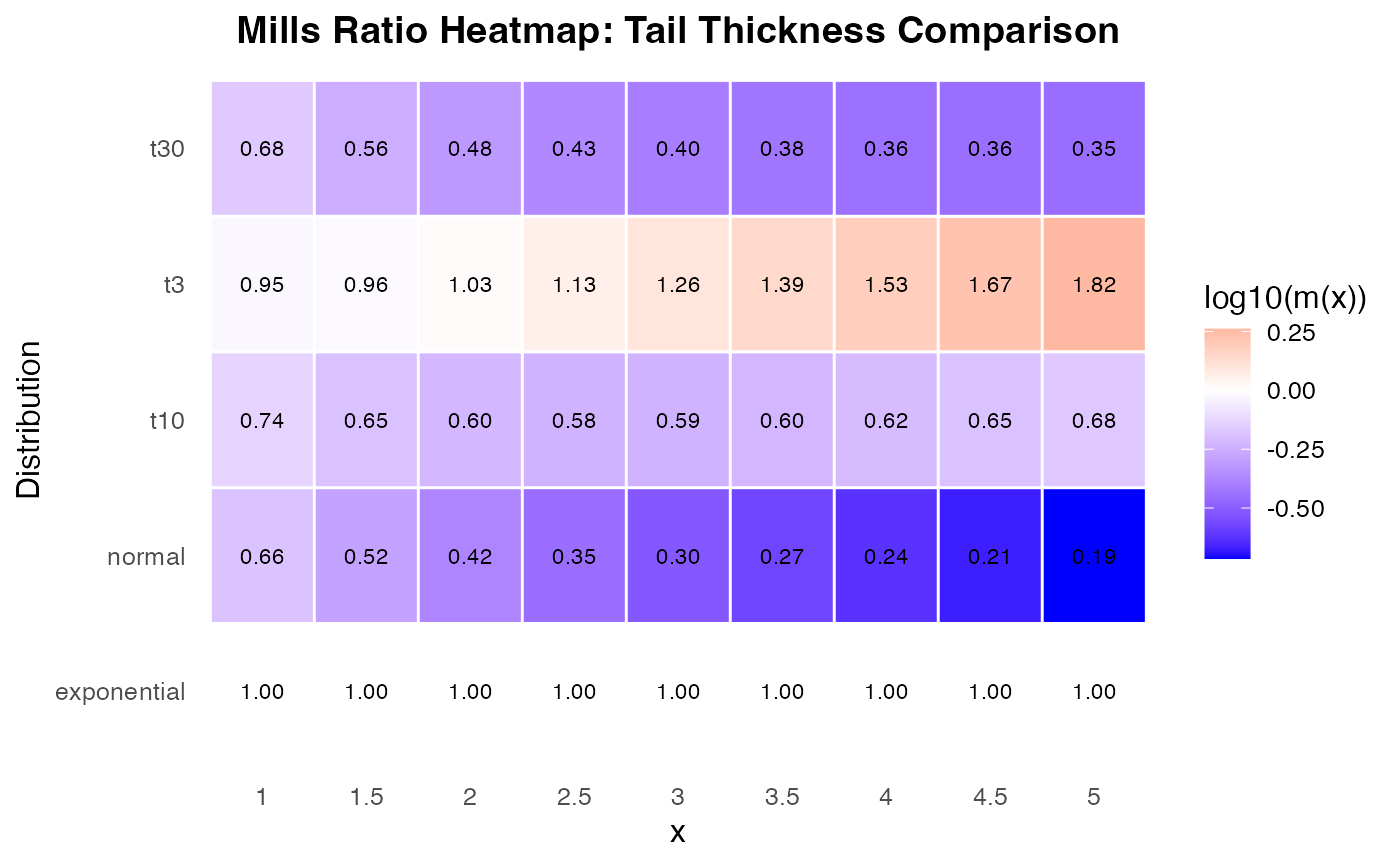
Examples
plot_tail_thickness_heatmap(
  x_points = seq(1, 5, by = 0.5),
  distributions = c("normal", "t3", "t10", "t30", "exponential")
)