Plot Mills Ratio Comparison
Usage
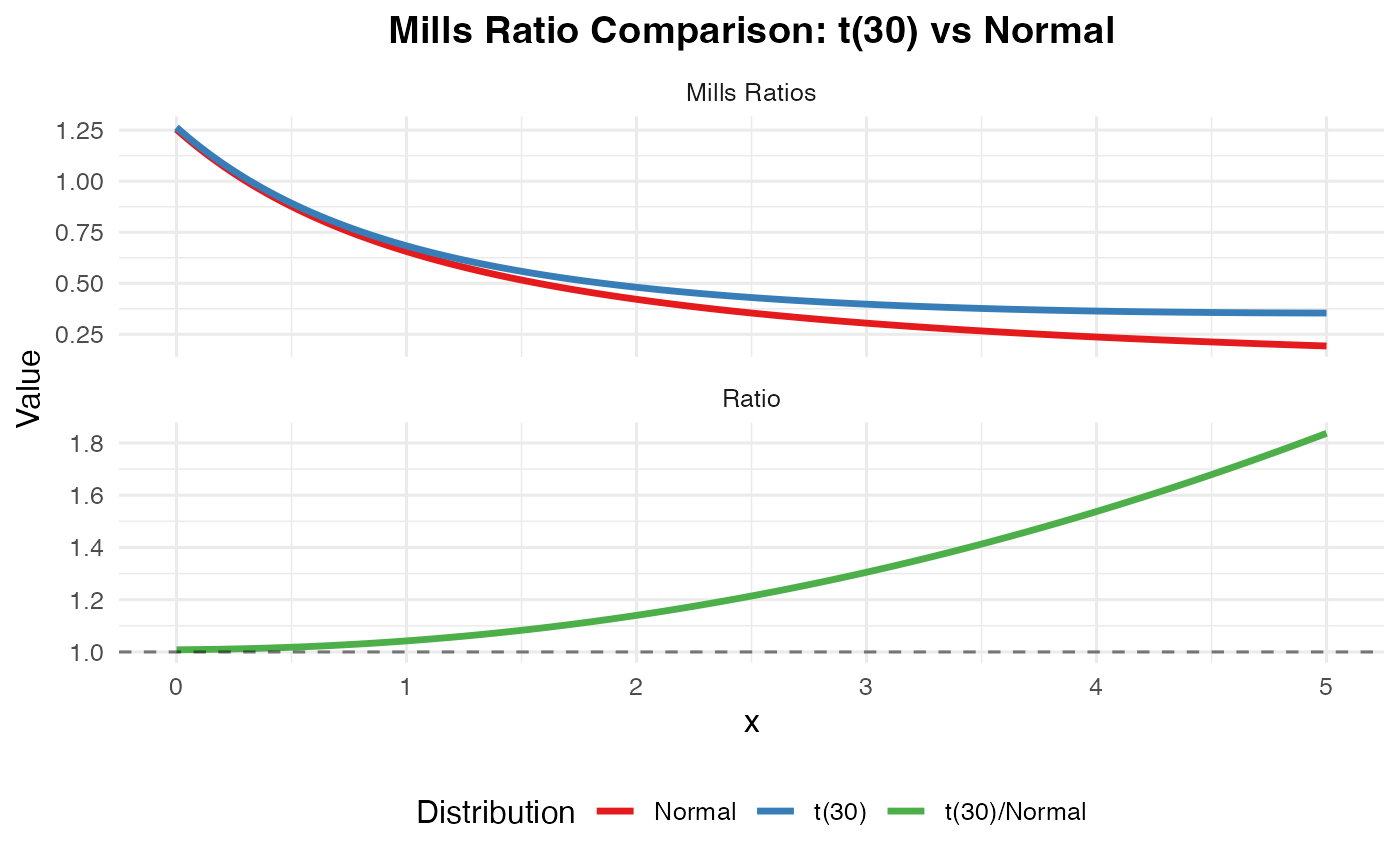
plot_mills_comparison(
  x_range = c(0, 5),
  dist1,
  dist2,
  df1 = NULL,
  df2 = NULL,
  show_ratio = TRUE
)
Arguments
- x_range
Range of x values
- dist1
First distribution
- dist2
Second distribution
- df1
Degrees of freedom for first distribution
- df2
Degrees of freedom for second distribution
- show_ratio
Logical; if TRUE, shows ratio plot
Examples
plot_mills_comparison(c(0, 5), "t", "normal", df1 = 30)